 English


Hopes for Rate Cut Fade? Key Non-Farm Payrolls Data to Determine Market Fate!
Next week, the much-anticipated non-agricultural employment index for November will be released. This indicator will play a decisive role in the Fed's interest rate decision in December. Being able to gain insight into the dynamics of non-agricultural data in advance is crucial for us to predict the direction of investment trends. Therefore, we must take a closer look at the economic data released this month. Only in this way can we reveal the potential trend of non-agricultural data and carefully consider our investment decisions.
 11005
11005S&P U.S. manufacturing and services PMI exceeded expectations in November
Both manufacturing and service PMIs rose
In the macroeconomic field, the US economic data in November showed positive signs.Specifically, both the U.S. manufacturing and service purchasing managers' indexes (PMI) increased. The preliminary Markit manufacturing PMI value in November reached 48.8, which is the highest point in the past four months. It was in line with market expectations and slightly higher than the previous month's 48.5.
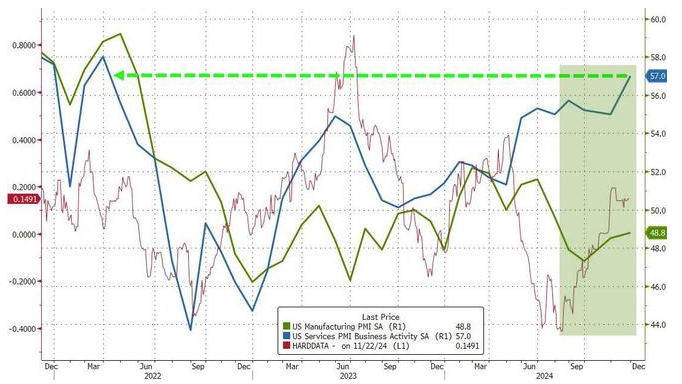
The initial value of the services PMI reached 57, a new high in 32 months, exceeding expectations of 55.2 and higher than the 55 in the previous month.
The preliminary comprehensive PMI value also reached 55.3, the highest level in 31 months. It exceeded the expected 54.3 and was higher than the 54.1 in the previous month.
Consumer confidence index drops unexpectedly
However, the performance of the US consumer confidence index is somewhat unexpected.
The final value of the University of Michigan Consumer Confidence Index in November was lowered to 71.8, lower than the expected 73.7 and lower than the initial value of 73. This was a slight increase from October's final reading of 70.5.
Regarding future inflation expectations, the final one-year inflation rate is expected to be 2.6%. It was in line with expectations, unchanged from the initial reading and slightly below October's final reading of 2.7%.
Real estate market data falls short of expectations

On the housing market front, October's housing starts and building permit data fell short of expectations.
The annualized total of new housing starts was 1.311 million units, lower than the 1.33 million expected and slightly lower than the revised previous value of 1.353 million. The preliminary annualized total number of building permits in October was 1.416 million households, lower than the expected 1.43 million households and slightly lower than the final value of 1.425 million households in September.
However, the NAHB Housing Market Index rose 3 points in November to 46, the highest level since April this year. The rise was mainly due to improved sales expectations and optimism that the Trump administration could reduce regulatory burdens.
Market optimism and prospects for interest rate cuts
Is market optimism the basis for interest rate cuts? Let's look at the data for early November next.Last week, there was an unexpected drop in the number of people filing for unemployment benefits in the United States, which may indicate a pickup in November's non-farm payrolls data. This follows a significant slowdown in employment growth in October due to the impact of hurricanes and strikes.
According to data released by the Labor Department on Thursday, the number of initial jobless claims for the week ended November 16 was a seasonally adjusted 213,000. There were 6,000 fewer people than the previous week, lower than market expectations of 220,000.It is worth noting that the statistical period of this data includes the US Veterans Day holiday, which may cause certain fluctuations in the data.
Typhoon & strike affect employment data
Layoffs have remained low despite a surge in jobless claims in early October due to hurricanes Helen and Milton and strikes by workers at aerospace companies such as Boeing. This has alleviated the weakness in the job market to a certain extent.
The statistical cycle of the initial jobless claims data coincides with the government's business survey cycle of non-farm payrolls in the November employment report.
Government data showed hurricanes and strikes were the main factors behind a sharp slowdown in job growth in October. In addition, state-level employment and unemployment reports also reflected the continued slowdown in the labor market.
November Jobs Data May Determine if the Fed Cuts Rates Again in December
Impact of October non-farm payrolls data
Economists predict that nonfarm payrolls may have fallen by 100,000 to 125,000 in October due to strikes and hurricanes. The increase was only 12,000, the lowest increase since December 2020. That compares with an increase of 223,000 in September.
November employment forecast
As the Boeing strike ends and hurricane-stricken areas rebuild, new jobs are expected to increase by at least 100,000 in November. Next week's release of continuing claims data will provide more clues about the state of the labor market in November.
Fed's interest rate cut decision
The November jobs report may influence the Federal Reserve's decision on whether to cut interest rates again in December. Previous data suggested that progress towards lowering inflation to the 2% target has stalled over the past few months. Earlier this month, the Federal Reserve lowered its benchmark overnight interest rate by 25 basis points to a range of 4.50%-4.75%.
Disagreement within Citigroup
Citigroup's interest rate strategists and economists are divided over the Fed's interest rate cut. Strategists Jabaz Mathai and Alejandra Vazquez believe the Fed should pause its easing policy unless the December employment data shows clear weakness. They suggested investors look to overnight index swap (OIS) rates to prepare for a possible pause in rate cuts by the Federal Reserve in December.
Meanwhile, Citi economists Andrew Hollenhorst and Veronica Clark insist that the possibility of a 50 basis point rate cut by the Fed in December remains, although the possibility has diminished. They believe a 25 basis point rate cut would be more likely if the unemployment rate stayed at 4.1% rather than rising.
Market expectations and policy adjustments
Bond investors have generally reduced their expectations for further easing by the Federal Reserve next year. Citi economists expect the November nonfarm payrolls report to show fewer than 150,000 new jobs, compared with a median market forecast of 220,000.
They believe that if the Fed wants to suspend interest rate hikes in December, employment will need to increase by at least 300,000. At the same time, the core consumer price index needs to rise by at least 0.35% in November. As employment and inflation data change, the Fed's policy path may be further adjusted in the future.
These expectations and policy adjustments are reflected in global stock market performance. During the week from November 18th to 22nd, global stock markets were active, which may be related to changes in investor expectations for Federal Reserve policy. Market participants' sensitive response to economic data, especially on employment and inflation, directly affects their forecasts of the Fed's policy path. This in turn affects the investment sentiment and performance of the stock market.
Could U.S. stocks become popular? Configuration directions and suggestions
Global stock market performance
Global stock markets were active during the week from November 18 to 22. The S&P Oil & Gas Index rose significantly, reaching 5.49%. Technology stocks also performed strongly, with the Nasdaq 100 rising 1.87% and the S&P 500 rising 1.68%. Of the 11 industry sectors in the S&P 500, 10 rose. The consumer staples sector led the way with a 3.10% gain, while the communications equipment sector fell 0.30%.
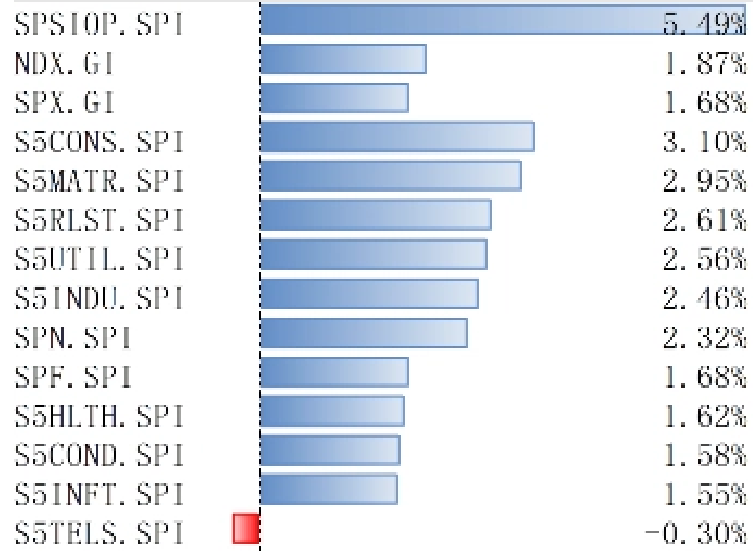
Data source: Wind
Investment allocation dynamics
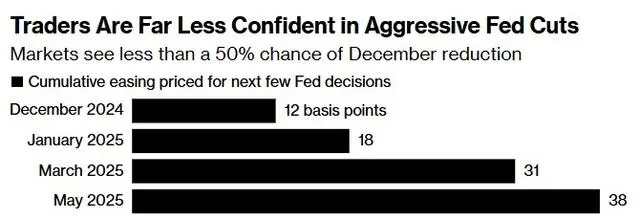
The U.S. stock market surged as manufacturing and services PMI data exceeded expectations, and the dollar remained strong. Gold and Bitcoin prices rise as geopolitical conflicts intensify. The hawkish stance of Federal Reserve officials has led to market expectations that the probability of a 25 basis point rate cut in December has dropped to 56%.
In the short term, November's non-agricultural data may rebound as the impact of hurricanes and strikes subsides, CPI may continue to rise, and there is uncertainty about interest rate cuts in December.In the medium term, Trump's policies may bring upward risks to inflation and the pace of interest rate cuts may slow. Investors should pay attention to the minutes of the Federal Reserve's November FOMC meeting and October PCE data.
Global market capital flows
Global equity inflows decreased, bond market inflows accelerated, and currency markets turned to outflows. Inflows into U.S. stocks slowed and outflows from emerging markets accelerated. Specifically, the inflow of U.S. stocks decreased to US$2.30 billion, the outflow from developed Europe accelerated to US$2.50 billion, the Japanese stock market turned to an outflow of US$660 million, and the outflow from emerging markets increased to US$2.28 billion.
Calibration of investment tools
For investors, the S&P 500 ETF (513650) is an ETF product that tracks the U.S. S&P 500 Index. It helps investors capture the growth gains of U.S. stocks with low management costs and efficient trading models. The S&P 500 Index covers more than 500 listed companies in 11 industries in the United States. It accounts for approximately 80% of the total market capitalization of the U.S. stock market.
 Data source: Bloomberg
Specific investment strategies

S&P 500 daily K-line chart, as of 2024/11/27 | Data source: TradingView
Looking at the daily K-line chart of the S&P 500 Index, we can see that the index is currently in an upward channel. It is particularly noteworthy that the current price level of 6021 points is the same as the all-time high set on November 11. This indicates that this price level is a key overhead resistance level. To judge whether the index can break through this resistance level, we can use the MACD indicator for analysis.
Currently, the DIF line in the MACD indicator has crossed the DEA line, forming a so-called "golden cross". This technical formation is often viewed as a buy signal, suggesting that the market may continue to rise. Based on this signal, we can reasonably speculate that the S&P 500 index is expected to break through the current resistance level.Once the index successfully breaks through the resistance level, it is expected that there will be a certain degree of pullback after hitting the upper edge of the ascending channel.
This is a technical retracement of a resistance level breakout. . If this prediction holds true, the upside potential for the S&P 500 index could be as high as 6,200 points. Of course, the actual market trend needs to be comprehensively judged in conjunction with other technical analysis tools and market sentiment.

Trending Articles
- Who Is Andrew Tate and Why Is He Famous? 10 Things to Know the Controversial Influencer
Discover who is Andrew Tate and why he's making waves in the digital sphere. Uncover 10 intriguing facts about this controversial influencer, his journey, and his impact on the online world.
2024-03-01 TOPONE Markets Analyst
 - Andrew Tate Net Worth 2024: Is the Internet's Most Controversial Man Worth $800 Million?
Explore the enigmatic Andrew Tate's net worth and delve into the controversies surrounding the internet's most polarizing figure. Is he truly worth $800 million? Uncover the truth behind his wealth and reputation here.
2024-02-23 TOPONE Markets Analyst - 20 Strongest Currencies in the World in 2024
Want to know the strongest currencies in the world in 2024? Here are the list for you!
2024-01-30 TOPONE Markets Analyst - Falling Wedge Pattern: The Ultimate Guide
A falling wedge is a bullish pattern characterized by a wide top and shrinking bottom. It is an extremely bullish pattern in a trading market.
2023-09-25 TOPONE Markets Analyst

 Bonus!

Bonus rebate to help investors grow in the trading world!
